
Page last updated 30/08/2018

First Order Rate Model
The parameters that describe biogas production are:
The volume of the container: V in m
3
The Retention time: R is the time the feed material is in the container, for a batch plant.
For a continuous digester: , where v m
3
is the volume fed each day.
The digestible matter in the slurry can be measured from the dry weight in the feed material and the volatile solids (VS)
proportion or the Chemical Oxygen Demand (COD).
The initial concentration (S
0
) of digestible matter in the slurry is then measured as kg.VS m
-3
or kg.COD m
-3
. As biogas is
produced, the concentration of the digestible matter (S) reduces.
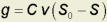
The first assumption is that the gas produced is proportional to the mass of feed material (substrate) digested:
The total (cumulative) gas production G m
3
is measured for a batch plant, while the daily gas production g m
3
d
-1
is used for
continuous plants.
C m
3
kg.VS
-1
or m
3
kg.COD
-1
is defined as the biogas potential and is assumed to be constant for a feed material.
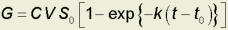
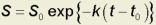
The second assumption is that the rate of gas production (how fast biogas is produced) is proportional to the concentration of
the substrate:
k d
-1
is defined as the rate constant.
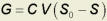
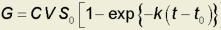
For a batch plant, this gives:
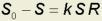
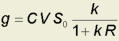
For a continuous plant, mass in - mass out = mass converted per day:
Values for C and k have been determined for cattle dung in the UK for batch and S-C (semi-continuous) operations.


C and k for food waste in UK
VS (Batch)
Temp (°C)
C m
3
kgVS
-1
k d
-1
34
0.47
0.73

C and k for cattle dung in UK
VS (Batch)
COD (Batch)
VS (S-C)
COD (S-C)
Temp (°C)
C m
3
kgVS
-1
k d
-1
C m
3
kgCOD
-1
k d
-1
C m
3
kgVS
-1
k d
-1
C m
3
kgCOD
-1
k d
-1
34
0.895
0.0129
0.513
0.0188
0.402
0.083
0.247
0.081
25
0.829
0.0068
0.525
0.0090
0.289
0.069
0.237
0.078
16
0.514
0.0038
0.178
0.033
0.164
0.026
The value of k for longer times (more than 35 days) drops (to 0.0033 d-1 for VS for 34°C).
The values for C and k for the same temperatures are different for batch and S-C plants. This suggests that values for BMP
measured using in batch mode might not be applicable to a plant run in S-C mode.
The values for C (measured in m
3
of methane, not biogas) and k for food waste was obtained from “The Biogas Handbook”.

This suggests much more research is needed to measure BMP for both batch and S-C modes, so they can be compared.


Page last updated 30/08/2018
The parameters that describe biogas production are:
The volume of the container: V in m
3
The Retention time: R is the time the feed material is in the
container, for a batch plant.
For a continuous digester: , where v m
3
is the volume
fed each day.
The digestible matter in the slurry can be measured from the
dry weight in the feed material and the volatile solids (VS)
proportion or the Chemical Oxygen Demand (COD).
The initial concentration (S
0
) of digestible matter in the slurry is
then measured as kg.VS m
-3
or kg.COD m
-3
. As biogas is
produced, the concentration of the digestible matter (S)
reduces.
The first assumption is that the gas produced is proportional to
the mass of feed material (substrate) digested:
The total (cumulative) gas production G m
3
is measured for a
batch plant, while the daily gas production g m
3
d
-1
is used for
continuous plants.
C m
3
kg.VS
-1
or m
3
kg.COD
-1
is defined as the biogas potential
and is assumed to be constant for a feed material.
The second assumption is that the rate of gas production (how
fast biogas is produced) is proportional to the concentration of
the substrate:
k d
-1
is defined as the rate constant.
For a batch plant, this gives:
For a continuous plant, mass in - mass out = mass converted
per day:
Values for C and k have been determined for cattle dung in the
UK for batch and S-C (semi-continuous) operations.
First Order Rate Model

C and k for cattle dung in UK
VS (Batch)
COD (Batch)
Temp (°C)
C m
3
kgVS
-1
k d
-1
C m
3
kgCOD
-1
k d
-1
34
0.895
0.0129
0.513
0.0188
25
0.829
0.0068
0.525
0.0090
16
0.514
0.0038

Temp (°C)
C m
3
kgVS
-1
k d
-1
C m
3
kgCOD
-1
k d
-1
34
0.402
0.083
0.247
0.081
25
0.289
0.069
0.237
0.078
16
0.178
0.033
0.164
0.026
C and k for cattle dung in UK
VS (S-C)
COD (S-C)
The value of k for longer times (more than 35 days) drops (to
0.0033 d-1 for VS for 34°C).
The values for C and k for the same temperatures are different
for batch and S-C plants. This suggests that values for BMP
measured using in batch mode might not be applicable to a
plant run in S-C mode.
The values for C (measured in m
3
of methane, not biogas) and
k for food waste was obtained from “The Biogas Handbook”.

C and k for food waste in UK
VS (Batch)
Temp (°C)
C m
3
kgVS
-1
k d
-1
34
0.47
0.73
This suggests much more research is needed to measure BMP
for both batch and S-C modes, so they can be compared.


